

Producer prices for courier and express delivery services outpaced courier production workers' average hourly earnings across the United States after 2021, expanding the spread to 25.2 index points by December 2025. Across the full window, producer prices rose 67.1 percent while courier production hourly earnings rose 28.4 percent. Consumer delivery prices grew even faster, rising 69.9 percent from September 2019 to September 2026, leaving consumer price inflation 2.8 percentage points above producer price growth over that shared span.
Divergence between courier producer prices and production earnings
The price index and the earnings index began from a common base of January 2019 = 100. In April 2020, the price index stood at 103.6 while the earnings index was 98.09, meaning the price index was 5.51 points above the earnings index. In December 2021, the earnings index reached 115.9 while the price index registered 113.4, meaning the earnings index was 2.5 points above the price index.

Interpretation: The earnings index briefly exceeded the price index before reversing direction.
In December 2022, the price index rose to 124.5 against 116.5 for the earnings index, meaning the price index was 8 points above the earnings index. In December 2023, the price index reached 133.0 while the earnings index stood at 122.0, meaning the price index was 11 points above the earnings index. In December 2024, the price index moved to 144.7 against 128.1 for the earnings index, meaning the price index was 16.6 points above the earnings index. In December 2025, the price index reached 156.3 compared to 131.1 for the earnings index, meaning the price index was 25.2 points above the earnings index.
Year-by-year paths of earnings and delivery prices
Courier production workers' average hourly earnings rose 7.7 percent on a December-on-December basis in 2020, peaked at 11.8 percent in 2021, and slowed to 2.3 percent in 2025.

Producer prices for couriers and express delivery services grew 3.7 percent on a December-on-December basis in 2020, peaked at 9.8 percent in 2022, and recorded 8.0 percent in 2025.

Interpretation: Producer price growth peaked after courier production workers' average hourly earnings growth peaked.
Consumer delivery prices on a December-on-December basis rose 1.0 percent in 2020, peaked at 13.3 percent in 2022, and reached 9.7 percent in 2025.

Long-run change across delivery indexes
Cumulative growth over the shared window from September 2019 to September 2026 shows consumer delivery prices increasing 69.9 percent from a starting level of 318.128. Over the same September 2019 to September 2026 window, producer prices for couriers and express delivery services rose 67.1 percent from an opening level of 239.8. Over this window, CPI-U delivery & courier services grew 2.8 percentage points more than PPI couriers & express delivery services.
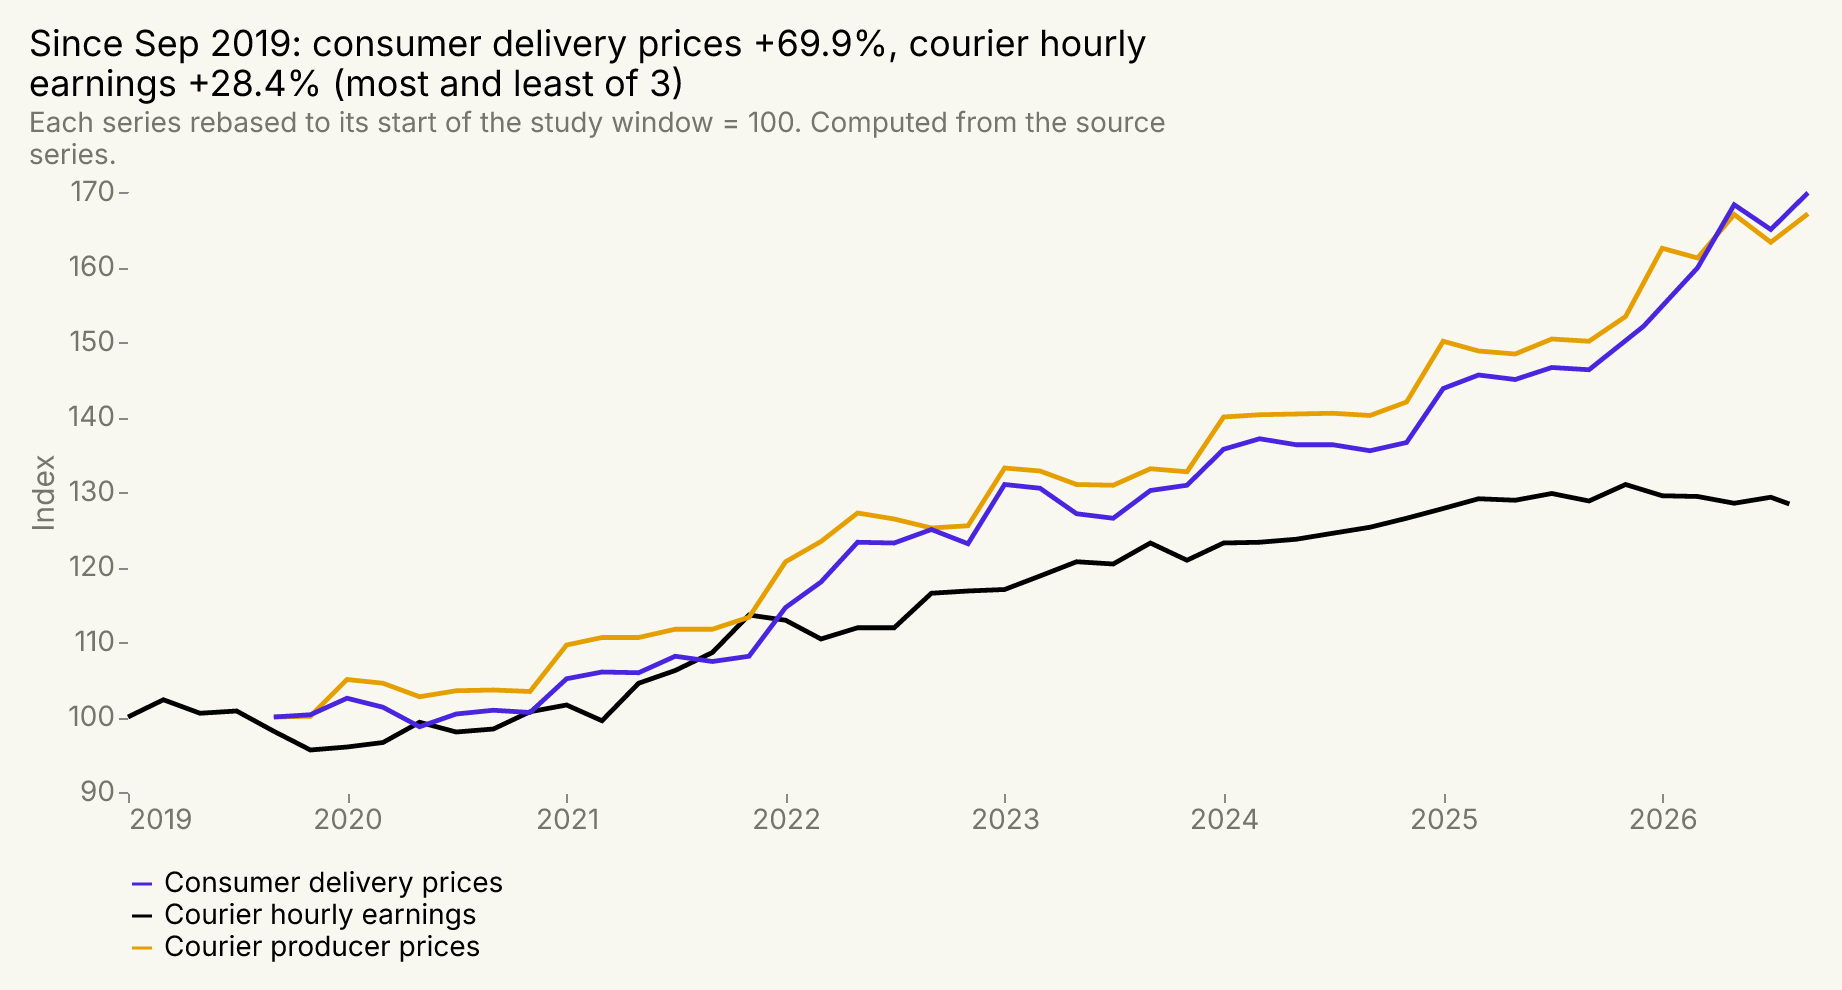
Producer prices grew faster than consumer delivery prices in four calendar years: 2020, 2021, 2023, and 2024. Consumer delivery prices grew faster in 2022 and 2025.
Courier production workers' average hourly earnings grew 28.4 percent over their full window from January 2019 to August 2026, rising from an opening level of 18.8 dollars per hour. In the comparison indexed to January 2019 = 100 through August 2026, the producer price index reached 166.5 while the courier earnings index reached 128.4.

When indexed to January 2019 = 100 through September 2026, the producer price index reached 167.9, while the consumer delivery price index reached 171.5.

Last twelve months of earnings and rate movement
Courier production workers' average hourly earnings fell 0.9 percent over the year-over-year window from August 2025 to August 2026, down from 24.35 dollars per hour. In the twelve months from September 2025 to August 2026, courier production workers' average hourly earnings had a minimum of 24.13 dollars per hour and a maximum of 24.64 dollars per hour.
Producer prices for couriers and express delivery services increased 11.4 percent over the year-over-year window from September 2025 to September 2026, up from 359.903 to 400.821. Across the twelve-month period from October 2025 to September 2026, producer prices recorded a minimum of 359.711 and a maximum of 400.821.
Consumer prices for delivery and courier services climbed 16.2 percent over the year-over-year window from September 2025 to September 2026, up from 465.269 to 540.51. In the twelve months from August 2025 to September 2026, consumer delivery prices recorded a minimum of 465.269 and a maximum of 540.51.
What this means
Producer prices for courier and express delivery services grew faster than courier production workers' average hourly earnings between 2019 and 2026. Producer prices rose 67.1 percent from September 2019 to September 2026, while courier production workers' average hourly earnings rose 28.4 percent from January 2019 to August 2026. The divergence between the two series reached 25.2 points in favor of the price index by December 2025. Over their respective final twelve-month windows, courier production workers' average hourly earnings fell 0.9 percent, producer prices rose 11.4 percent, and consumer delivery prices rose 16.2 percent. The data records industry-level prices and earnings, but cannot show individual contract terms or firm-level operating margins.
Methodology
This study was published by Finmile using monthly series from the U.S. Bureau of Labor Statistics. Couriers avg hourly earnings, production (USD) covers 92 periods from January 2019 to August 2026 under series CES4349200008. PPI couriers & express delivery services covers 93 periods from January 2019 to September 2026 under series PCU492110492110. CPI-U delivery & courier services covers 91 periods from January 2019 to September 2026 under series CUUR0000SEEC02. The divergence analysis indexed series PCU492110492110 and series CES4349200008 to January 2019 = 100 using the formula: (monthly value / January 2019 value) * 100. The divergence gap was calculated as the price index minus the earnings index. Cumulative growth was calculated as ((end value - start value) / start value) * 100. The growth gap was calculated as consumer delivery price cumulative growth minus producer delivery price cumulative growth. December-on-December percentage change was calculated as ((December value in year t - December value in year t-1) / December value in year t-1) * 100, and year-over-year change was calculated as ((current month value - year-ago month value) / year-ago month value) * 100. Data covers national industry aggregates and does not isolate regional variations or non-wage benefits.